Billy Napier’s famous “scared money don’t make money” phrase is a statement about analytics. You can go read the story about it. The last quote within is about how he works with analytics companies (note: plural) each year on how to get an edge.
New men’s basketball coach Todd Golden got the job in no small part because he is known to be on the forefront of analytics. The new theme in Florida’s revenue sports, to varying degrees of notoriety, is one about analytics.
I know what image “analytics” conjures for a lot of sports fans. It’s either the movie adaptation of Michael Lewis’s book Moneyball, or it’s a bunch of guys who at best look like Dwight Schrute hunched over spreadsheets.
In reality, going big with analytics is simply an embrace of probabilistic thinking. It’s a quite useful mindset if you can manage it.
You Already Think in Probabilities
The jargon of sports is littered with examples of probabilistic thinking.
- Favorite/underdog: the more likely and less likely participant to win
- Upset: the most likely game outcome didn’t happen
- Ceiling/floor: we talk about teams having ceilings or floors that are high or low, which is a way of setting boundaries on their expected range of performance
- Average: comes up in dozens of ways, from simple stats to whether a player or team is at, above, or below average
- Consistent: saying whether a team/player is or isn’t consistent is a layman’s way of talking about variance
And so on. Embracing analytics simply means you acknowledge that’s it’s probabilities all the way down.
Distributions
In other words, all players and teams are like a box of chocolates. You never know what you’re going to get on any given Saturday. Oh hey, there’s another cliche about probabilistic thinking.
We tend to think about performers being individual points. The way we rank things all but guarantees it.
This team is No. 1, this team is No. 2, and this team is No. 22. Simple order-based ranking is the least useful way of ranking things, since it doesn’t tell you how big the gaps are between each thing listed.
But even with more advanced ranking systems like SP+, FEI, ESPN’s FPI, or whatever else, you still have to eventually boil everything down to a single number in order to rank teams by that number. Individual stats at least default to this format, so you can see by how much the leading passer beat the second-best guy or whatever.
In truth, no one is a single point. The point is an abstraction, and a limited one at that.
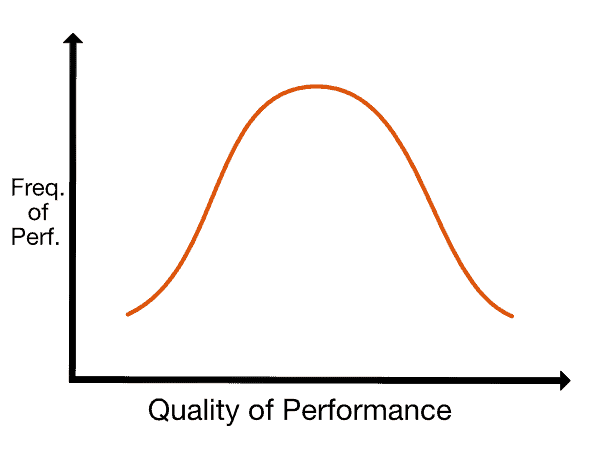
Think about an average team that mostly plays average ball. They’re capable of playing great or terribly, but most of the time they’re going to be somewhere in the middle. That team isn’t a single point around the national average; it’s something very much like a bell curve.
Here, the more to the right you go, the better the team plays. The higher you go, the more likely the team is to play at that performance level. Simple enough, right?
This orange team has a floor of the left end of its curve and a ceiling of the right end of the curve. The top of the curve is its modal performance, which is also around its average performance.
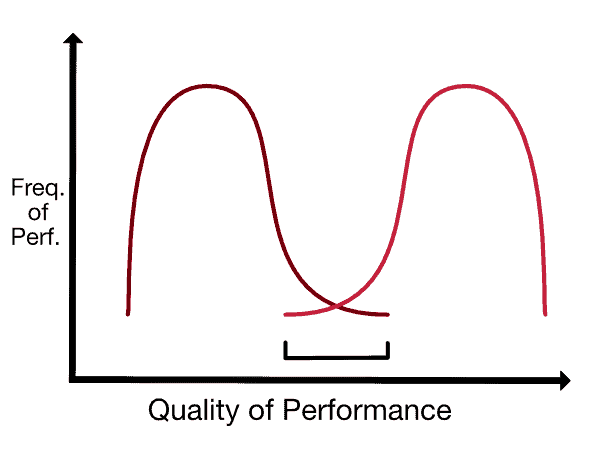
Now consider a pair of entirely hypothetical teams called Smeorgia and Smouth Smarolina. The former is very good and almost always plays well. It’s probably headed to a New Year’s 6 game. The latter is not very good and usually plays poorly. It’s probably headed to a 4-8 finish. What happens when they meet?
You would expect Smeorgia to win most games between the teams. However, if the stars align and the teams both play in the area bracketed — red Smeorgia at the low end of its range and garnet Smouth Smarolina at the high end of its range — then an upset can happen.
This is probabilistic thinking in images.
It’s hard to get precise distributions for teams because there are so few games in college football. You’ll get teams like Smeorgia, who play great except for a single, veritable no-show game in every season since 2017 where they either lose by 17+ points or drop a game they have no business losing. In the case of such a team, you get a cluster of points at the far right end of the graph and one way to the left, and good luck guessing when that leftward point is coming. Analytics can only take you so far when human beings are involved.
So What Then?
Okay great, but what is anyone supposed to do with this?
The concepts of risk and uncertainty are often conflated in everyday use, but they are different things. Risk refers to a situation where the outcome is unknown but you can made at least an educated guess about the probabilities. Uncertainty refers to a situation where the outcome is unknown and it’s not possible to figure out the odds of the potential outcomes.
What analytics does is move things from the realm of uncertainty to the realm of risk.
Napier mentioned going for it on fourth down. It might or might not be worth doing it depending on the game state. The football analytics community has spend years nailing down the odds fairly well, which allows a coach to know well whether he should do it provided he’s willing to live with the slings and arrows of probabilities.
The old way of thinking was that coaches never went for it on fourth down unless they felt guaranteed to get it, like when facing 4th & 1 deep in a clearly overmatched opponent’s territory, or they were forced to do it by a score deficit. Ask a coach 40 years ago if it’s worth going for it on 4th & 3 on his own 37-yard-line early in a tied game, and the answer would likely have been an automatic no. If pressed on it, he’d give a complete guess.
What Napier and other analytics-minded coaches do is acknowledge that it may be worth it in less certain situations. If you’re, say, 70% likely to get it, then it could be worth it to go for it then. You just have to be willing to live with the 30% of the time when you won’t get it. At least you now have the information to know. It’s a risk, not an uncertainty.
Fourth down is one of the most obvious — and most easily calculated — situations of risk in football, so it’s a dead horse that’s been well beaten by now. However, the sport is actually quite hard to apply SABR-style analytics (as highlighted in Moneyball) to because there are so many interdependent parts. Little is as simple as one pitcher facing one batter.
It’s hard, but it can be done with careful thought, creativity, and effort. Napier has built an army of analysts to, well, analyze the program and its upcoming opponents. He gets it. He hired people to do that hard work.
Turning uncertainty into risk doesn’t make the world any less risky. What it does is empower people to make better informed decisions, so they at least know what the alternatives are and which course of action is most likely to lead to success. You then try to always do the thing that makes success most likely and trust that over time you’l come out ahead.
If you want to understand how Napier is running the Gator football program, it will be useful to train yourself to think in probabilities and appreciate analytics. You may end up with different opinions than him about what’s the right course of action, but you’ll at least understand where he’s coming from.


