


Of all the things that happened last season, Kyle Trask’s three interceptions in the Cotton Bowl is still the most shocking to me. It probably shouldn’t have been, as he was down his top four wide receivers and top tight end. Things were just off for everyone, but he’d been so accurate for so long, it felt like watching an impossibility.
Had Trask sat out the bowl, he would’ve finished the season with five picks on 409 attempts. That computes to an interception rate of 1.22%, which is terrific. It’s possible to push your rate lower than that, but it usually involves throwing a lot of short, safe passes. Trask was throwing the ball down the field quite a bit and topped ten yards per attempt in pre-bowl play.
I’ve been looking into interceptions this week and can put some perspective on what Trask and Dan Mullen quarterbacks in general have done in recent years with interceptions. Using CFBStats.com‘s data, I’ve looked at passers with at least 24.5 attempts per game and 300 total attempts on the season from 2009 to present. Those parameters help make sure that noisy performances from players with relatively few attempts stay out of the data, and it just barely includes Feleipe Franks and his 24.8 attempts per game from 2018. Hey, I’m a Florida writer. I can make affordances when needed.
Interception rates are falling
My work on this topic was inspired by Ed Feng’s interception report about the NFL from last fall. He noted that pick rate has been falling on the pro level, from an average of over 5% in the 1970s to 2.4% in 2019.
The same thing is happening in college, at least over the last dozen years.
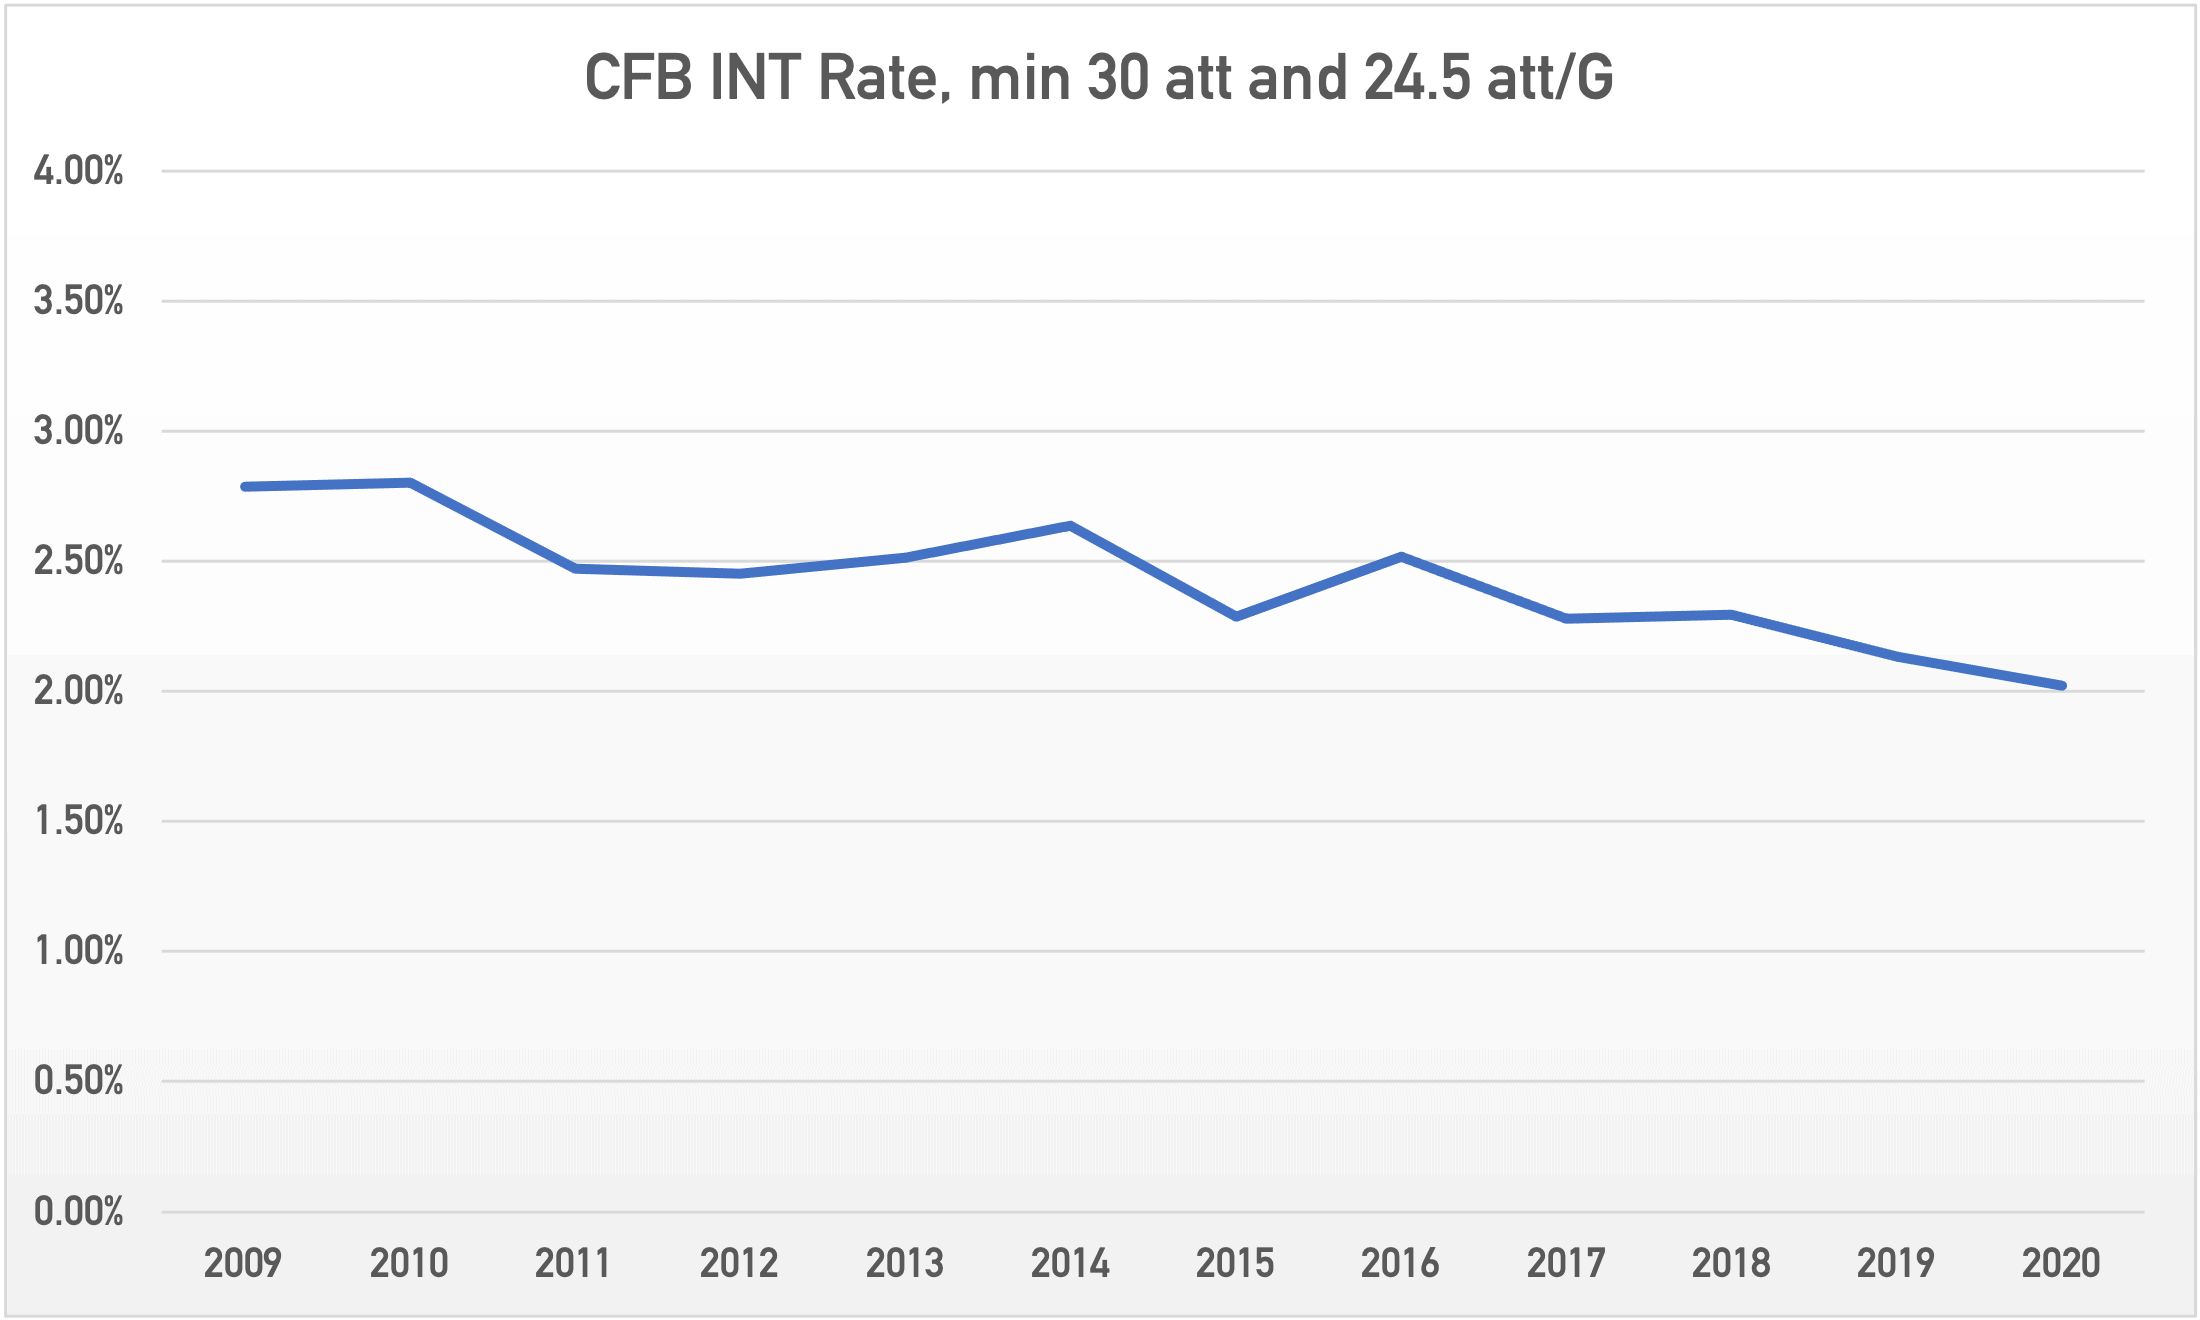
Interception rate for passers who qualify bounced around between 2.9% and 2.5% from 2009 to 2014 with a slightly downward trajectory. It broke through to 2.29% in 2015, and aside from a snap back to 2.52% in 2016, it’s been below 2.3% ever since.
In 2020, a season when offenses were ahead of defenses due to the pandemic disruptions, pick rate was a mere 2.02%. Only 27 passers qualified due to fewer than the normal amount of games being played; in all other years the number of qualifiers was in the 60s or 70s. The dip could’ve been somewhat due to a small sample size giving a more extreme result, but pick rate was 2.13% in 2019 and the ’20 figure followed the trend line. I don’t think that’s it entirely.
Age only sort of matters
It’s a trope that players get more accurate and discerning with time. In the numbers available to me, you can’t see it that strongly.
Unless otherwise stated, from here on out I’m only looking at the last six seasons (2015-20) because that’s when pick rate really started plunging. In those years among qualified passers, what class a passer is really only mattered for one class.
| Class | INT Pct | No. of Players |
|---|---|---|
| Freshman | 2.34% | 41 |
| Sophomore | 2.37% | 84 |
| Junior | 2.31% | 135 |
| Senior | 2.19% | 120 |
Seniors have a noticeably lower rate than younger players, but the rest are all about the same. How could this be?
Freshmen who get a long enough leash to throw more than 300 times and, rounding up, 25 times per game usually are pretty good players to begin with. Bad young passers don’t get to throw that much. Plus, game plans for inexperienced passers tend to emphasize safer throws.
I half expected the rate for juniors to be a little lower than for seniors, as the best junior passers can jump to the NFL early. It didn’t end up being the case, and there may not be enough of those players to make a difference.
Mullen quarterbacks
Among Mullen quarterbacks who qualified, the experience level pattern generally fits. Junior Tyler Russell in 2012 had an interception rate of 2.54%. Dak Prescott’s rate went from 2.54% as a junior to 1.05% as a senior. Nick Fitzgerald only qualified as a sophomore in 2016, and his pick rate was 2.77%. Franks’s rate was 1.86% as a redshirt sophomore in 2018, and it was down to 1.68% on 238 attempts at Arkansas last year. Trask went from 1.98% in 2019 to 1.83% in 2020 (again, 1.22% pre-bowl).
I’m not sure where to place Emory Jones here. Some of the reason pick rate was lower for Franks and especially Trask was Mullen employing short throws to replace run plays. He didn’t do that a ton in 2018 with Franks, but you remember a lot of stand passes against Mississippi State, for instance.
There shouldn’t be much, if any of that with the quarterback run back on the table this year. Jones only has one pick in 86 attempts, good for a rate of 1.16%, but he has mostly thrown the ball either in garbage time or when defenses have been greatly expecting run. It will go up as he runs a complete offense for an entire season, but whether he’ll be above or below 2% is something to watch.
As a side note, UF’s defense had a pick rate of 2.26% last year. It was all against Power 5 competition, as you remember. The 2019 defense had an interception rate of 3.88% against P5 foes, and the 2018 unit had a rate of 3.82%. Since “Power 5” became a thing in 2014, the next-lowest pick rate for the Gator defense was 3.68% in 2015. It was above 4% in 2014 and 2017, and it topped 5% in 2016. The only comparable rate since ’09 was 2.33% against BCS automatic qualifying competition in 2011.
Interceptions are becoming harder to come by in general, but the defense’s decline in picks last year was dramatically out of line with what Florida has done during the time the trend has been happening. Look for that rate to rise this fall, even if it doesn’t hit a level it might’ve a decade ago.