


In 2018, Florida was expected to have a deep receiving corps. In actuality, it worked out to be exactly that. Dan Mullen worked the tight ends and running backs into the passing game as well, and the end result was a situation where it was nearly impossible to guess who would star as a pass catcher from one game to the next.
With everyone notable at receiving returning plus an up-and-comer in redshirt freshman Jacob Copeland to go along with the tight end and running back positions, it’s going to be hard to predict ball distribution again in 2019. I broke down the 2018 distribution in detail to try to work out what to expect when next year comes along.
The figures below do not include anything from drives that ran out the clock at the end of halves. Nothing is missing from the individual players’ figures, but there might be something small and insignificant from the position groupings.
Catches
If nothing else, UF had a balanced set of targets.
The Gators had six receivers with at least ten catches. The lowest count among them was the 13 of Freddie Swain, who got hurt against Missouri and then missed the following two games. The next-lowest was 18 for Tyrie Cleveland, who broke his collarbone before he caught a pass against FSU and missed the bowl. The third-lowest was the 25 that belonged to Kadarius Toney, who missed the opener to suspension. Trevon Grimes (26) and Josh Hammond (28) edged out Toney, while Van Jefferson led the group with 35.
I made up a chart showing the catches through the season for these six receivers plus the running backs and tight ends as position groups. Lamical Perine and Jordan Scarlett both hit double digit receptions, though only just, while enough different tight ends played that none got to at least ten receptions. Because the RBs and TEs were pretty interchangeable within their groups as to what they did, it made the most sense to me to put them in here as groups.
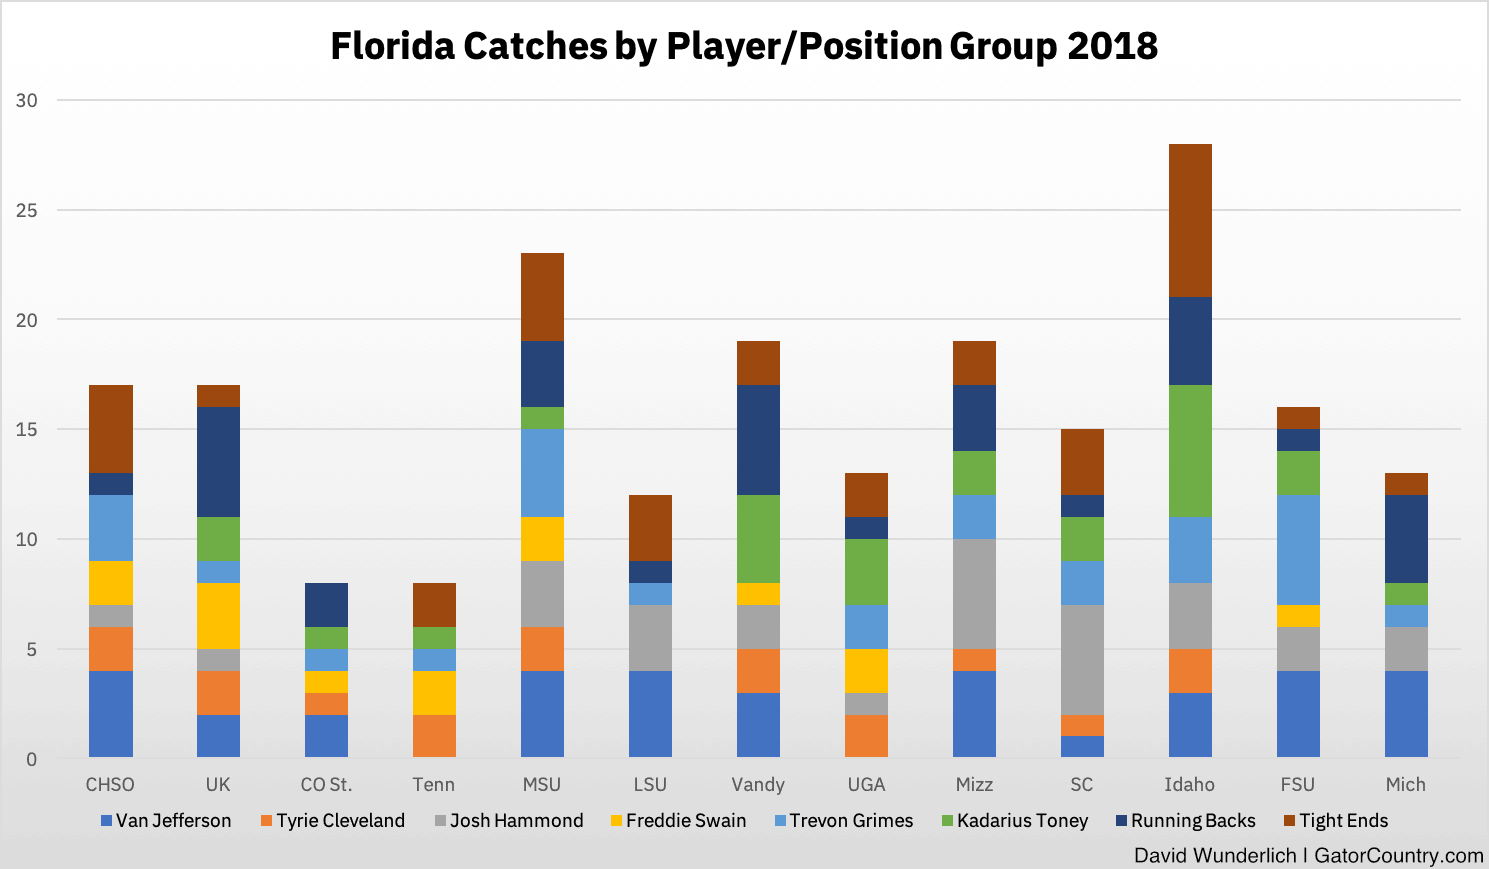
The first thing I’ll point out is that everyone, including the two position groupings, had at least one game with no catches. There were some missed games as I mentioned above, but that statement doesn’t even include those.
Jefferson was the team’s leading receiver but was shut out against Tennessee and Georgia. Cleveland, Swain, and Toney all came up empty against LSU, while Hammond had a two-week drought against Colorado State and UT. Grimes didn’t have a catch against Vanderbilt, while the running backs caught nothing against Tennessee and the tight ends didn’t against Colorado State.
Jefferson’s zero-catch day against Georgia’s elite defense was the only one after the bye week that didn’t involve injury somehow. Catch counts depend on the quarterback and defense, of course, but I don’t think it’s a coincidence that most of those zero-catch outings came early. Mullen was very obviously still figuring out what he had early on, not to mention the fact that he was very much coaching around an offensive line that didn’t hit its stride until late.
More telling than the catches are the targets, I think.
Targets
Here is the same chart again but with targets instead of catches.
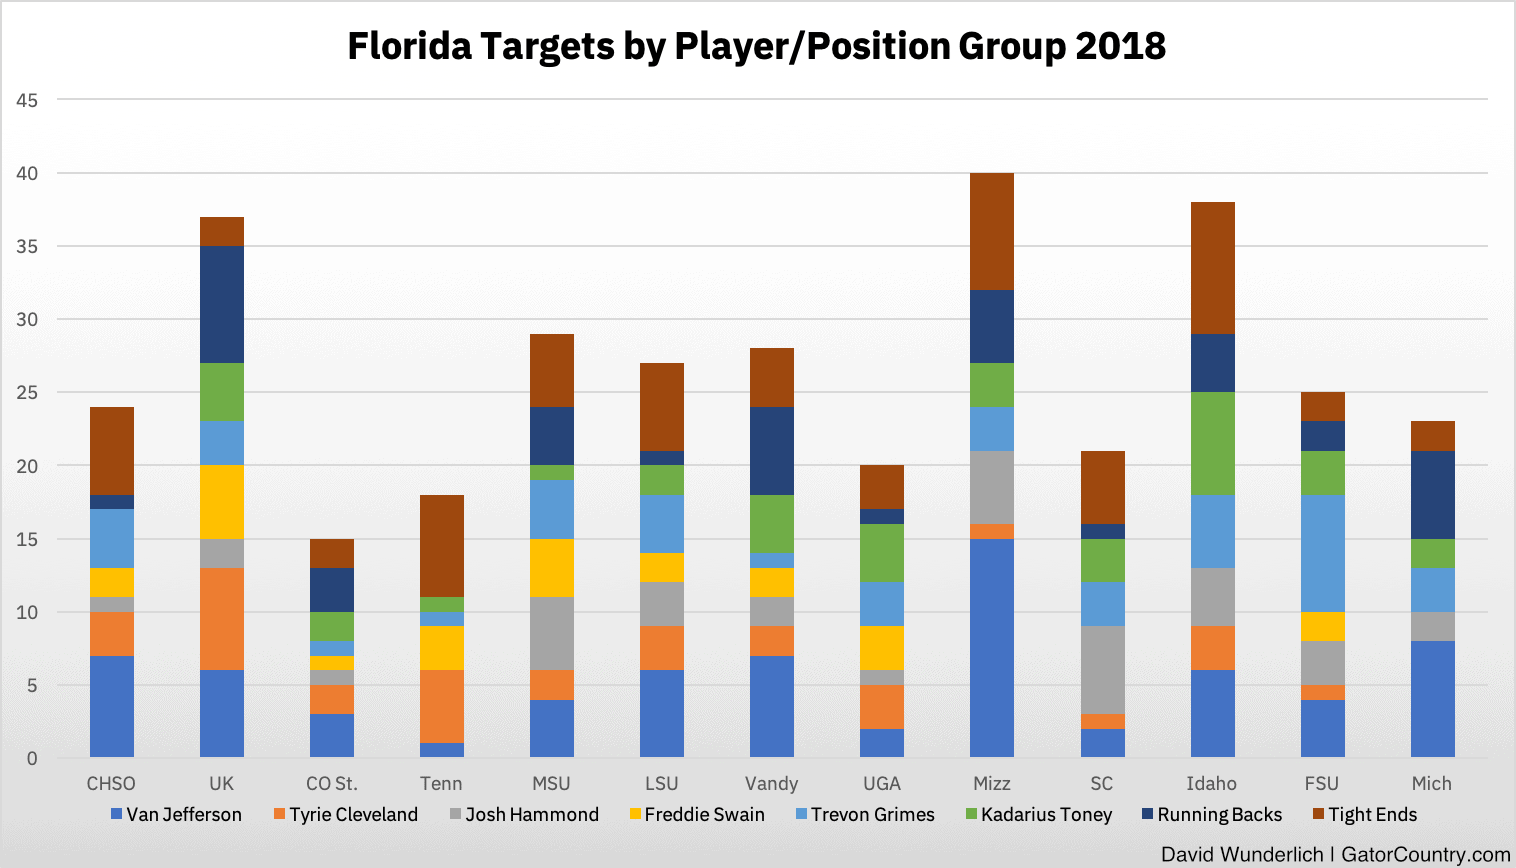
To tie up a loose end from the last section, both Hammond and the running backs in the Tennessee game were the only instances of having zero targets without an injury or suspension being in play.
Here we can see a few things about how the strategy worked out. The Kentucky, Vanderbilt, and Michigan games were the heaviest in running back usage. The Tennessee game involved a lot of Cleveland and the tight ends. Toney’s usage is small except for a two-game stretch against Idaho and Florida State. That came right after Mullen said in his South Carolina postgame comments that he hadn’t done a good job of getting Toney the ball.
Jefferson being the primary target stands out here, though I will note that his usage was pretty close to that of the tight ends. He had 71 targets, while the tight ends had 61. Jefferson had a massive 15 targets against Missouri, though, while no one else listed here including the groupings even reached ten in a game. If Jefferson had five targets against Mizzou, which was his average in the 12 other games, he would’ve tied the tight ends at 61 on the season.
Other things that pop out include Cleveland’s targets falling in the second half of the season even before he got hurt against FSU and the wildly variable targeting of Grimes. Grimes did get more work late after Swain’s injury, and he did a lot against FSU after Cleveland went out, but the tight ends also seemed to get more work while Swain was sidelined. Grimes didn’t have a particularly notable workload in the bowl either.
So that’s catches and targets. I’ve got one more chart for you next.
Yards
Here is the same stacked bar chart again, only this time it’s receiving yards.
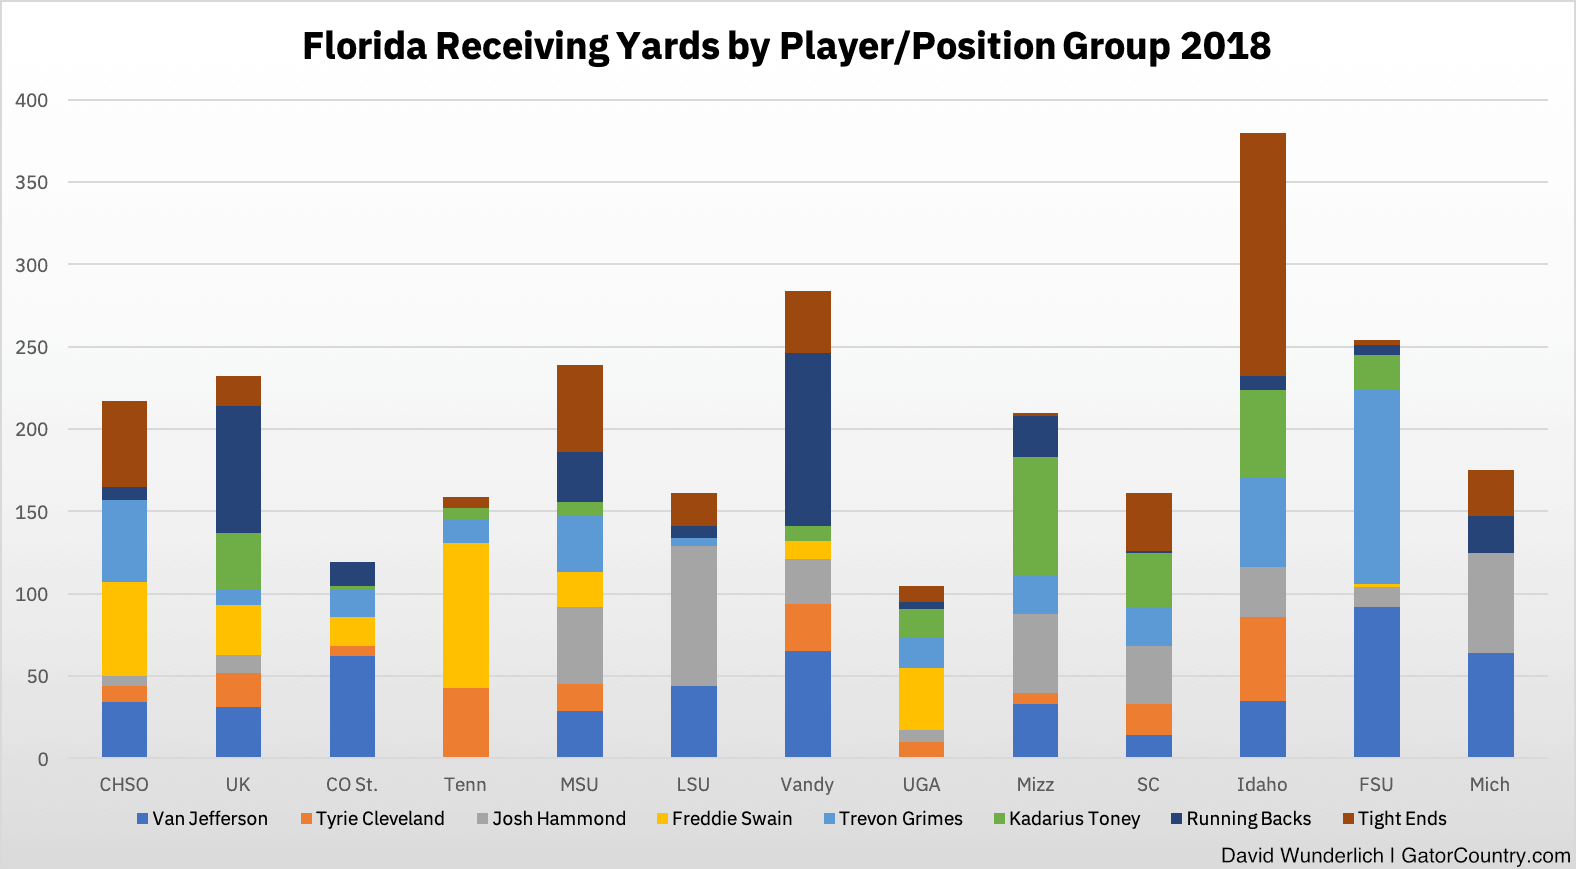
A few of these stacks are balanced, like the ones from the first two games, Mississippi State, and South Carolina.
More often, one or two dominate: Jefferson against Colorado State, Swain and Cleveland against Tennessee, Hammond and Jefferson against LSU, Jefferson and the running backs against Vandy, Hammond and Toney against Missouri, and Jefferson and Grimes against FSU. Jefferson, befitting his spot as the top receiver, was most commonly a standout.
So Jefferson aside, this is really where it shows up how variable the Florida receiving targets were. The targets weren’t wildly changing from week-to-week. The catches mixed things up more, but again quarterback play, the defense, and a factor like drops matter a lot there.
In yards, you really didn’t know who was going to shine from one game to the next. This is where the team’s depth and versatility really shows up. The target and catch figures show that while usage of the running backs, tight ends, and Toney changed a lot, the rest of the corps was pretty balanced in targets aside from Jefferson being at the top. Nonetheless, anyone else could step up in any game and shine.
Summing it up
Here is a table that gives a good conclusion, as it includes rates in addition to raw numbers.
| Player | Targets | Catches | Yards | Catch Pct. | Yds/Target | Yds/Catch | Targets/G |
|---|---|---|---|---|---|---|---|
| Van Jefferson | 71 | 35 | 503 | 49.3% | 7.1 | 14.4 | 5.5 |
| Tight Ends | 61 | 32 | 414 | 52.5% | 6.8 | 12.9 | 4.7 |
| Trevon Grimes | 43 | 26 | 364 | 60.5% | 8.5 | 14.0 | 3.3 |
| Running Backs | 42 | 31 | 307 | 73.8% | 7.3 | 9.9 | 3.2 |
| Kadarius Toney | 36 | 25 | 260 | 69.4% | 7.2 | 10.4 | 3.0 |
| Josh Hammond | 35 | 28 | 369 | 80.0% | 10.5 | 13.2 | 2.7 |
| Tyrie Cleveland | 33 | 17 | 212 | 51.5% | 6.4 | 12.5 | 2.8 |
| Freddie Swain | 24 | 14 | 265 | 58.3% | 11.0 | 18.9 | 2.2 |
Even though Jefferson was the top target, he caught under half of the balls thrown his way. A not-insignificant part of that low number was Feleipe Franks consistently overthrowing him on deep patterns. Some more of it was that Franks really liked to throw to him in general, so some number of his targets were balls where the quarterback was either trying to force something or just random bad throws that all quarterbacks have sometimes.
Still, you can see that Cleveland also had a low catch rate, and his usage did wane over the season. Swain’s was also relatively low, but he hit on enough big plays that he still led the team in yards per target and reception. The tight ends also had a low catch rate, in part due to a bad run of drops early on in the season.
These catch rates show a real place of slack in the offense. Jefferson and the tight ends were getting targeted a combined ten times a game on average, but the Gators only got five catches a game from that. Jefferson’s longer, lower percentage routes put a cap on his catch rate, but getting the completion percentage to him and the tight ends up would provide an easy way to get some improvement from the attack.
But here is where the real puzzle comes in. I mentioned Copeland at the top. For him to make any kind of impact at all, he will need to get some targets. Setting aside the possibility of injuries, where will those targets come from?
Probably not Jefferson. He was the most productive receiver of 2018, and he showed an elite ability to get open at times. He also was second on the team in yards per catch. He likely will not see his targets go down, especially if, as we saw against Michigan, Franks improves his ability to complete longer passes to him.
It won’t come from Hammond or Swain either. They were the top two in yards per target, and they combined for only five targets per game anyway. If anything, their high yards per target rates suggest they should get the ball more, not less.
And speaking of getting the ball more, that’s what Mullen said should happen for Toney after South Carolina. He ostensibly should be in line for more targets too.
That leaves taking targets from Cleveland and Grimes among the receivers, but they are big, outside receivers. Cleveland is 6’2″ and Grimes is 6’4″. Copeland is listed at 6’0″, and he will play a different kind of role. Diminishing the usage of Cleveland and Grimes would mean restructuring elements of how the entire offense works, and they only combined for six targets a game anyway. Plus, Grimes ended up third by a healthy margin in yards per target and basically matched Jefferson in yards per catch.
That leaves the running backs and tight ends. On the former’s account, you saw above that the running backs didn’t get consistent work in the pass game. They had a six games with zero or one targets and six other games with four or more targets. Defensive matchups seem to largely determine their usage in the passing game.
As for the tight ends, their usage doesn’t figure to decrease. Kyle Pitts will officially play wide receiver next year, but he basically was one this year given how he exclusively lined up out wide. He’s a size mismatch who will be worth throwing at. Lucas Krull is even more of a size mismatch and will have additional time under his belt getting back into the football groove after leaving baseball last year.
Kemore Gamble will see some targets simply based on the fact he’s the best established blocker in the group and therefore will be on the field a lot, while 2019 signee Keon Zipperer may be talented enough to force his way out there as a guy who really puts the hybrid in H-back. Pitts rebranding as a wide receiver in 2019 may make the tight end usage nominally go down, but only because of that listing change and not because of Copeland stealing targets from them.
The only option left is to run more plays per game. This might actually happen, since Florida will be in the second year of Mullen’s offense and therefore should be faster at getting plays in.
UF was 81st nationally in averaging 68.46 plays per game in 2018, but there were some unusual circumstances in there. For instance the Gators ran only 44 plays against Colorado State and 53 against Tennessee because non-offensive touchdowns robbed the offense of possessions. Take out those two games, and Florida ends up 50th at 72.09 plays per game. The defense could get opponents off the field faster, though there’s less work to be done there. Absent the CSU and UT games, UF’s defense would’ve been 20th (fewer is better) in plays per game faced at 64.55 per contest.
Another option would be to pass more. Counting sacks as pass plays, Florida threw 42.9% of the time in 2018. That’s a comparable rate to Mullen’s 2011 team that threw 43.4% of the time with Chris Relf connecting on a slightly higher percentage of passes for more than one yard fewer per completion. Passing, say, 47% of the time at 72 plays per game would yield 440 pass attempts, which given a 13-game schedule would be almost six more pass attempts per game than 2018 had. Copeland might get some of those, but again, some older guys are in line for more targets too.
Passing more necessarily means running less, though, and Florida has a deep stable of running backs. The question of how they split the ball in 2018 and how they might in 2019 is one I’ll address soon.