A common complaint of recent Florida offenses is that they’re predictable. It’s an easier thing to feel than to pin down quantitatively because of confirmation bias. We selectively remember all the times Florida runs on second down but forget when they go with play action instead. It’s just how the brain works.
Even so, there are ways to put numbers to tendencies and try to find areas where UF might do one thing or another at an unusually high rate. Running with an idea from Bill Connelly, the inventor of the S&P+ analytics system, I charted out Florida’s run play rate by quarter and scoring margin in the game.
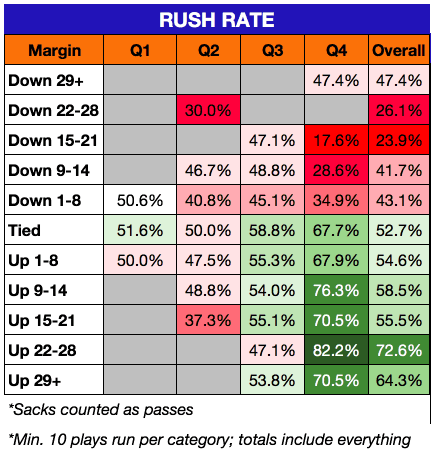
Here is the percentages for Florida running the ball from the beginning of 2015 through the Texas A&M game.

The figures aren’t 100% accurate because there are some quarterback scrambles on called pass plays counted as runs here. However, I did pull sacks out and count them as passes, which I believe Connelly’s piece does as well. I only put percentages in squares that had at least ten plays, but I included all data in the far right column totals. Also, the run rate for all UF plays was 50.8%, so red indicates run levels below that and green indicates run levels above that.
One perfectly natural tendency jumps out: the Gators tend to run less when behind and run more when ahead. Passing plays are higher risk than run plays, so teams that are up like to take fewer chances. If you refer to Connelly’s piece, he shows what all teams from 2006 to present have done. You see the exact same thing there.
A counterintuitive observation is that Florida is balanced early on but runs less in the second quarter regardless of margin. They still keep it an even mix when the game is tied in the second quarter, but otherwise, their run rate is at least a couple of percentage points below their overall average rate.
As odd as that would seem, it’s not unique to the Gators. If you refer to Connelly’s piece again, you’ll see below-average run rates in the second quarter nationally. Perhaps coaches trust their quarterbacks to throw more once they’re into the rhythm of the game, or some such cliché.
I will draw your attention to the fourth quarter. There is a drastic difference between the low run rates when Florida is behind versus the high run rates when the game is tied or UF has a lead.
This too matches all teams to an extent, and it again makes sense. When a team has a fourth quarter lead, it will run more to keep the clock moving and reduce the odds of a turnover.
However, Florida’s splits are much larger than for college football as a whole when it comes to operating with a small deficit versus a tie game. Overall, teams on average move from a 39.1% rushing rate when down by one score in the fourth quarter to 52.9% rush when the game is tied. That’s a shift of 14 percentage points.
Jim McElwain’s Gators, however, go from 34.9% run when down one score in the final frame to 67.7% run when the game is tied. They throw a bit more than normal when down and run a lot more than normal when tied. The run rate climbs by 32.8 percentage points, more than double what the national average does.
Teams nationally run about 68.6% of the time when protecting a one-score lead in the fourth quarter. In essence, Florida runs like a team that’s up by a small amount when the game is actually tied. That, I would say, is numerical evidence of a predictable play calling pattern that’s different from what most everyone else does.
Of course, Florida might be doing that because it works. Just knowing run rates isn’t enough. That’s why I did the same thing with success rates.
I use the Football Outsiders college definition for success rate. The play is a success if it gains at least 50% of yards to go on first down, 70% of the resulting yards to go on second down, and all of the needed yards to go on third or fourth down. The success rate then is simply the percentage of plays that end up a success by those criteria.
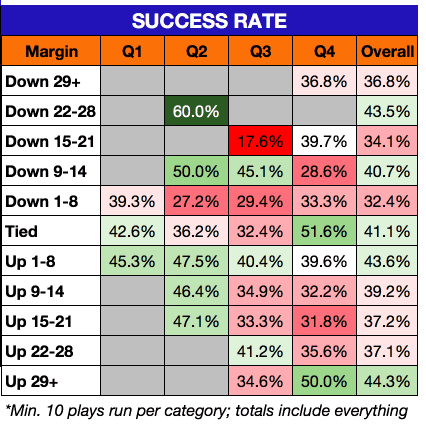
Here is the same table, but this time it’s with success rate. The team’s overall success rate is 39.7%, so the colors are red for worse than that and green for better than that.

If you look at the square for when the game is tied in the fourth quarter, it shows that success rate is quite high at 51.6%. Running that much late in tie games does seem to pay off quite handsomely in down-to-down efficiency.
The worrying place in reconciling the run rate chart and the success rate chart for me is when the team is down by one score in the second and third quarters. The Gators’ run rate is about seven percentage points lower than the national average in both cases. At the same time, they earn a success rate that is under 30% in these scenarios. Those are terrible figures.
Florida’s completion percentage in these situations is 45% in the second and a dismal 32% in the third. These percentages suggest to me that there is some combination of Florida attempting too many risky passes and defenses playing the pass very well.
To be clear, it’s not like the Gators are running much better at these times. The rushing success rate in each middle quarter when down by one score is only about three percentage points above the passing success rate. The best of any of them is a rushing success rate of 32.1% in the third quarter when down by one score. That’s still pretty bad.
This kind of analysis is interesting, and it could be used by the coaches to take an opportunity to reevaluate what they do when down by one score in after the first quarter. Whether they realize it or not, the offense becomes terribly inefficient during those times. More specific film study would reveal what the precise problems are.
Overall, Florida does tend to call a run/pass mix that hews closely to the national averages in most quarter and scoring margin scenarios. From a broad perspective, the Gators are similarly predictable to many other programs. They can improve, however, by taking a look at a few trouble spots like what I identified here and looking for opportunities to catch defenses off guard by going against their own past patterns.


I love the analytics, but they don’t account for downs. They don’t account for where those runs are directed. There are more factors to predictability than the pass/rush ratio of playcalling
Offensive problems I see does not deal with run pass distribution. I do not see enough miss direction plays in the run game. The speed of SEC defenses can be used against your opponent. It will not only use the flow of defense as an ally it will allow you to maximize quick hitters. Using plays from the same information will also keep your opponents confused. I not privy to if this relates to the current IQ of your young QB or it’s a function of bad play calling. In either case it needs to improve. I also believe the overall talent of the team is not were it needs to be. Many off field incidents have contributed to the overall talent on the roster, hopefully they will not be a factor in the next two recruiting classes that appear really strong on paper.
In the mean time I hope we can pull off the highly improbable of beating the Dawgs and then put a cherry on top by besting FSU.