

")
I’ve written a few times about a technique for predicting the winning percentage for a team based on points scored and points allowed. In 2021 in games against FBS competition, it looked at UF’s 329 points scored and 296 allowed and projected a .562 win percentage. In 12 games, that comes out to about 6.7 wins. So, they’d be expected to win six or seven games with a lean towards seven.
The Gators finished under that projection, going 5-7 in FBS competition. What was it about this team that caused that underachievement? The big picture answer can be found when looking at drive-level data.
For this whole piece, I’m eliminating games against FCS competition. I’ve always preferred to do that when comparing across seasons because there isn’t a lot to learn from what are usually lopsided blowouts. Then this year half the team took the Samford game off, so it again isn’t totally representative statistically, even if that result was in the spirit of what the Gators were this year.
Also, I removed special teams fumbles from the figures below.
Offense
Florida had 11.6 drives per game in 2021, which is the same to the first significant digit as in 2018 and 2019. The team was slightly lower at 11.2 in 2020, but all four years it was roughly the same.
The 2020 team stands out as having a far higher touchdown percentage and far lower punt percentage than the other four teams did. This is as you would expect.
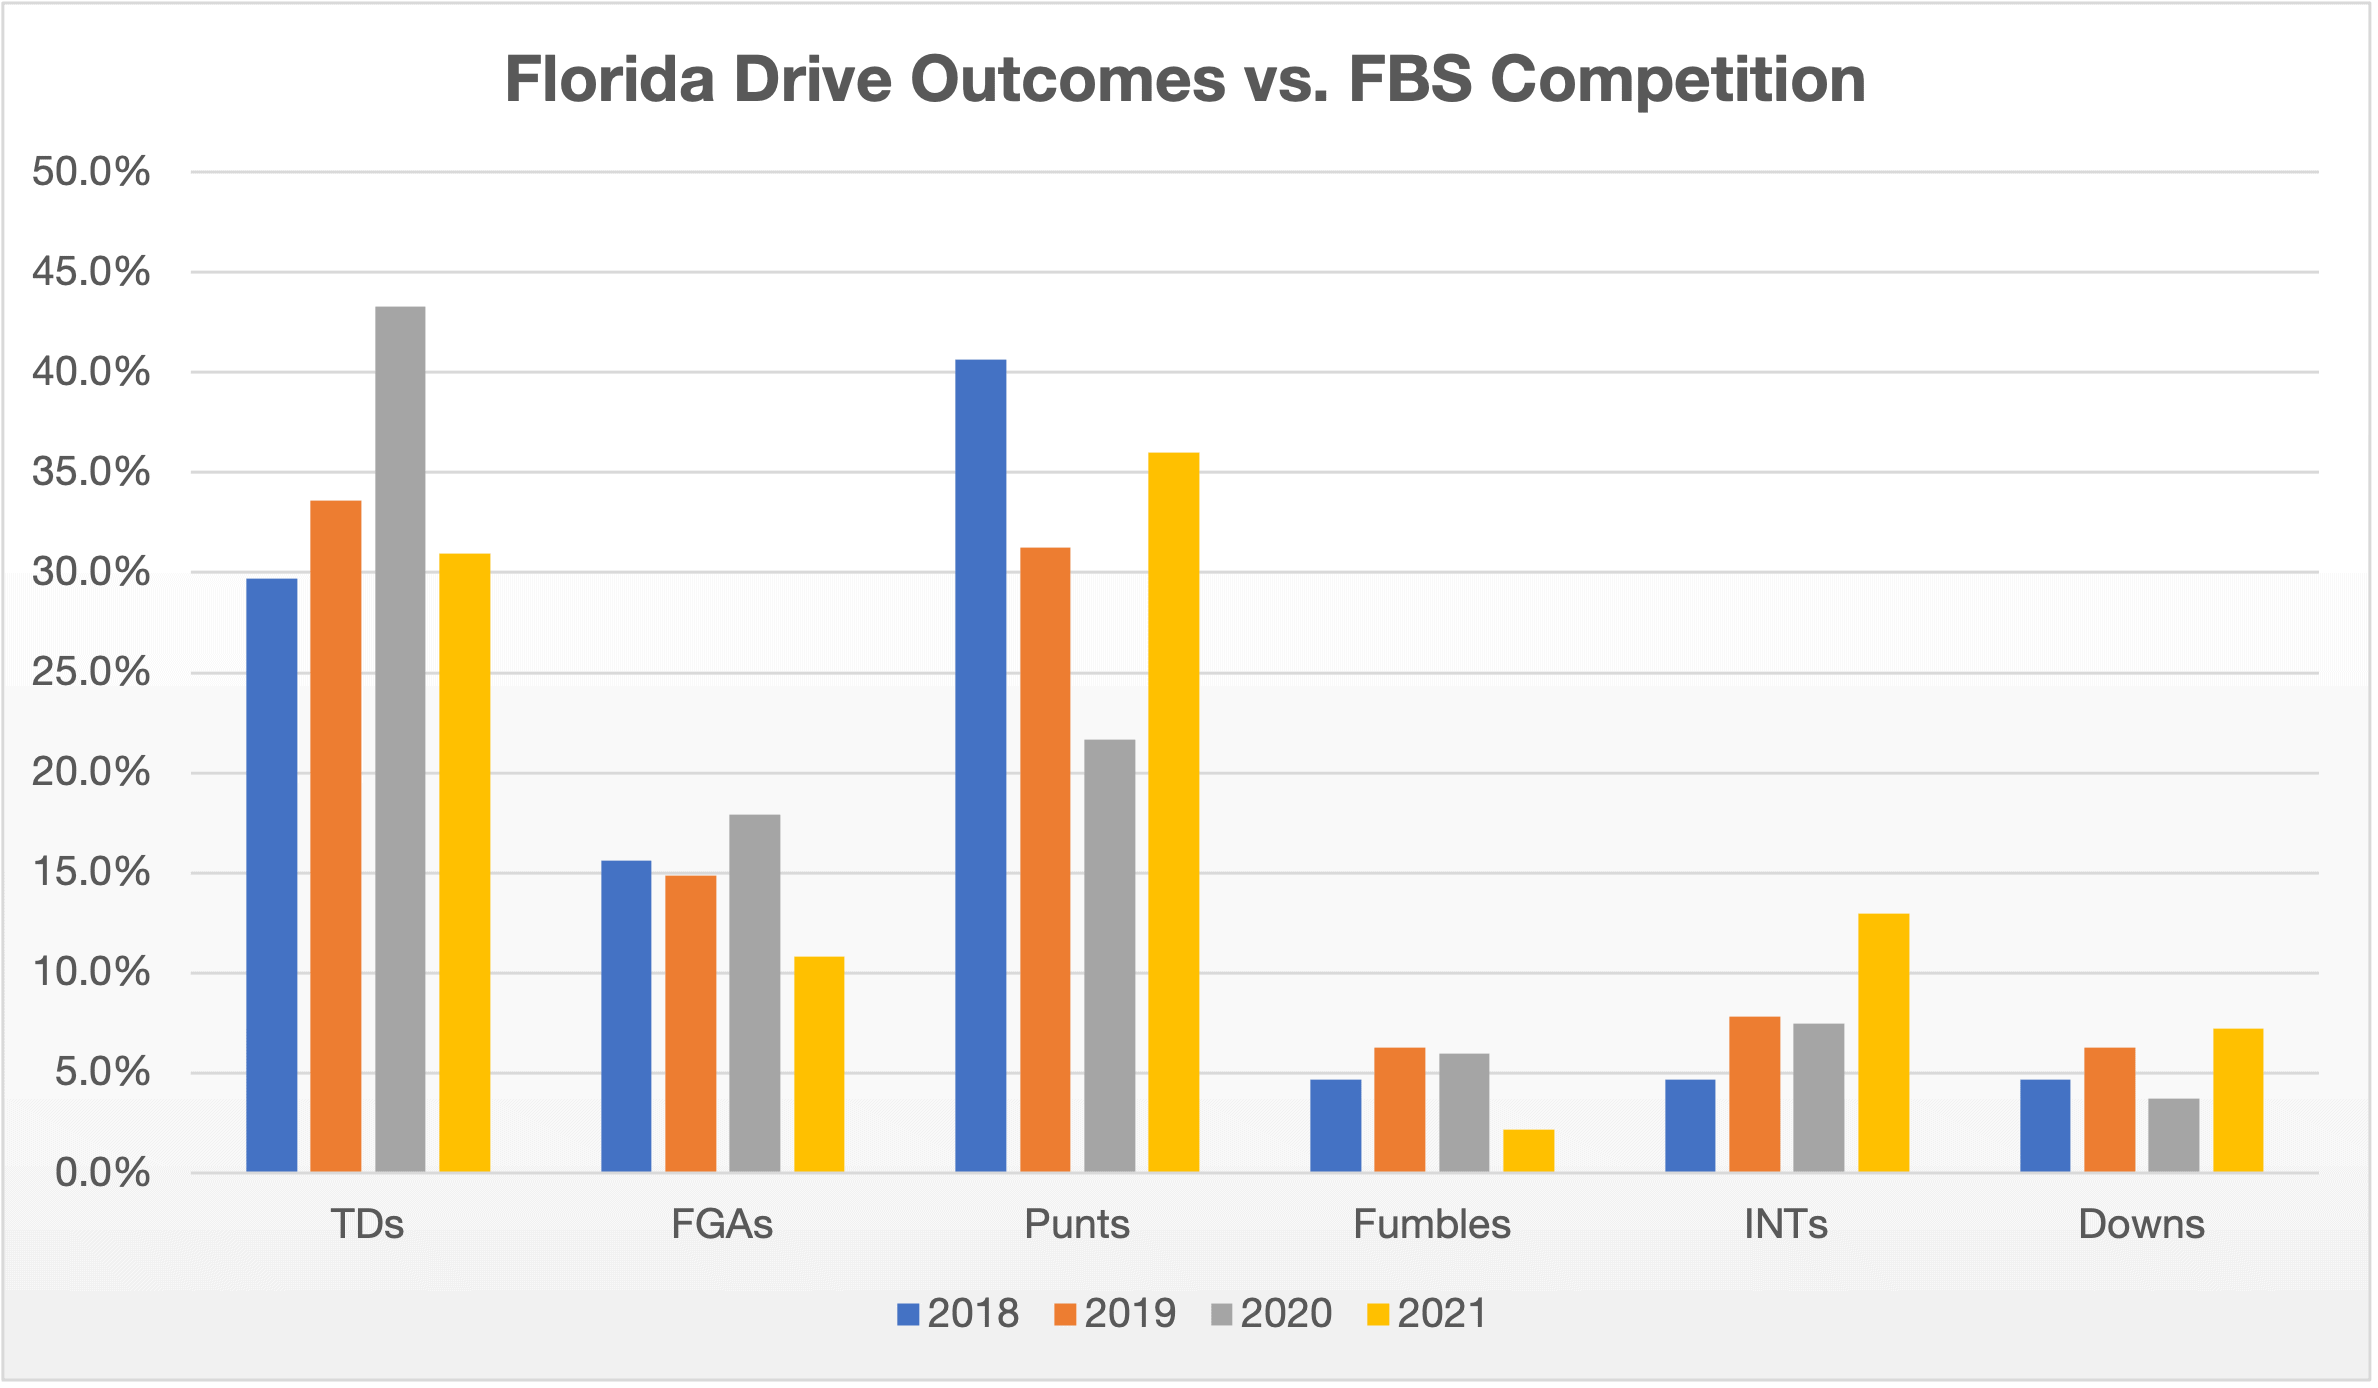
The 2021 team was about in line with the 2018 and 2019 teams in touchdown percentage, though it attempted appreciably fewer field goals after losing Evan McPherson to the draft. It didn’t punt as much as the 2018 team did, though the ’18 team easily took the best care of the ball among Dan Mullen’s four teams. Its turnover percentage was 9.4%, with 2020 next at 13.4%, 2019 at 14.1%, and 2021 at 15.1%. Last fall’s team did turn it over on downs the most, but turnovers on downs are a small share of drive outcomes overall.
A simpler way to look at this is to see how often a team got a touchdown or field goal attempt versus coming up empty via punt, turnover, or downs.
![]()
The ’21 team simply came up empty far more often than it got in the end zone or attempted a kick. The 2018 and 2019 teams also operated at a deficit, but the gap was much closer. Last year’s team was almost a mirror image of the 2020 team in this regard.
The 2021 Gators weren’t wildly outside the parameters of past Mullen seasons except in the low field goal attempt figure. It’s just that the 2018-20 teams ranged across the highs and lows of the bad outcomes, while the 2021 team was at the high end of all of them. It punted the second-most, turned it over the most, and turned it over on downs the most. The latter two happened on the plus side of the field enough that they almost certainly play into the lower field goal attempt rate.
The Gators scored touchdowns often enough to score more like the 2018 team (30.8 PPG) or 2019 team (31.7), but they killed drives enough to be more than a field goal below them (27.4 PPG).
Defense
The Florida defense crashed hard in 2020, so the largest factor for team success in 2021 was always going to be tied to how much it could snap back and improve.
The result is that the defense did improve marginally but not by nearly enough to help the team meet expectations. Combine that with an offense that, in terms of scoring, was the worst of the Mullen era, and a hard fall was going to happen.
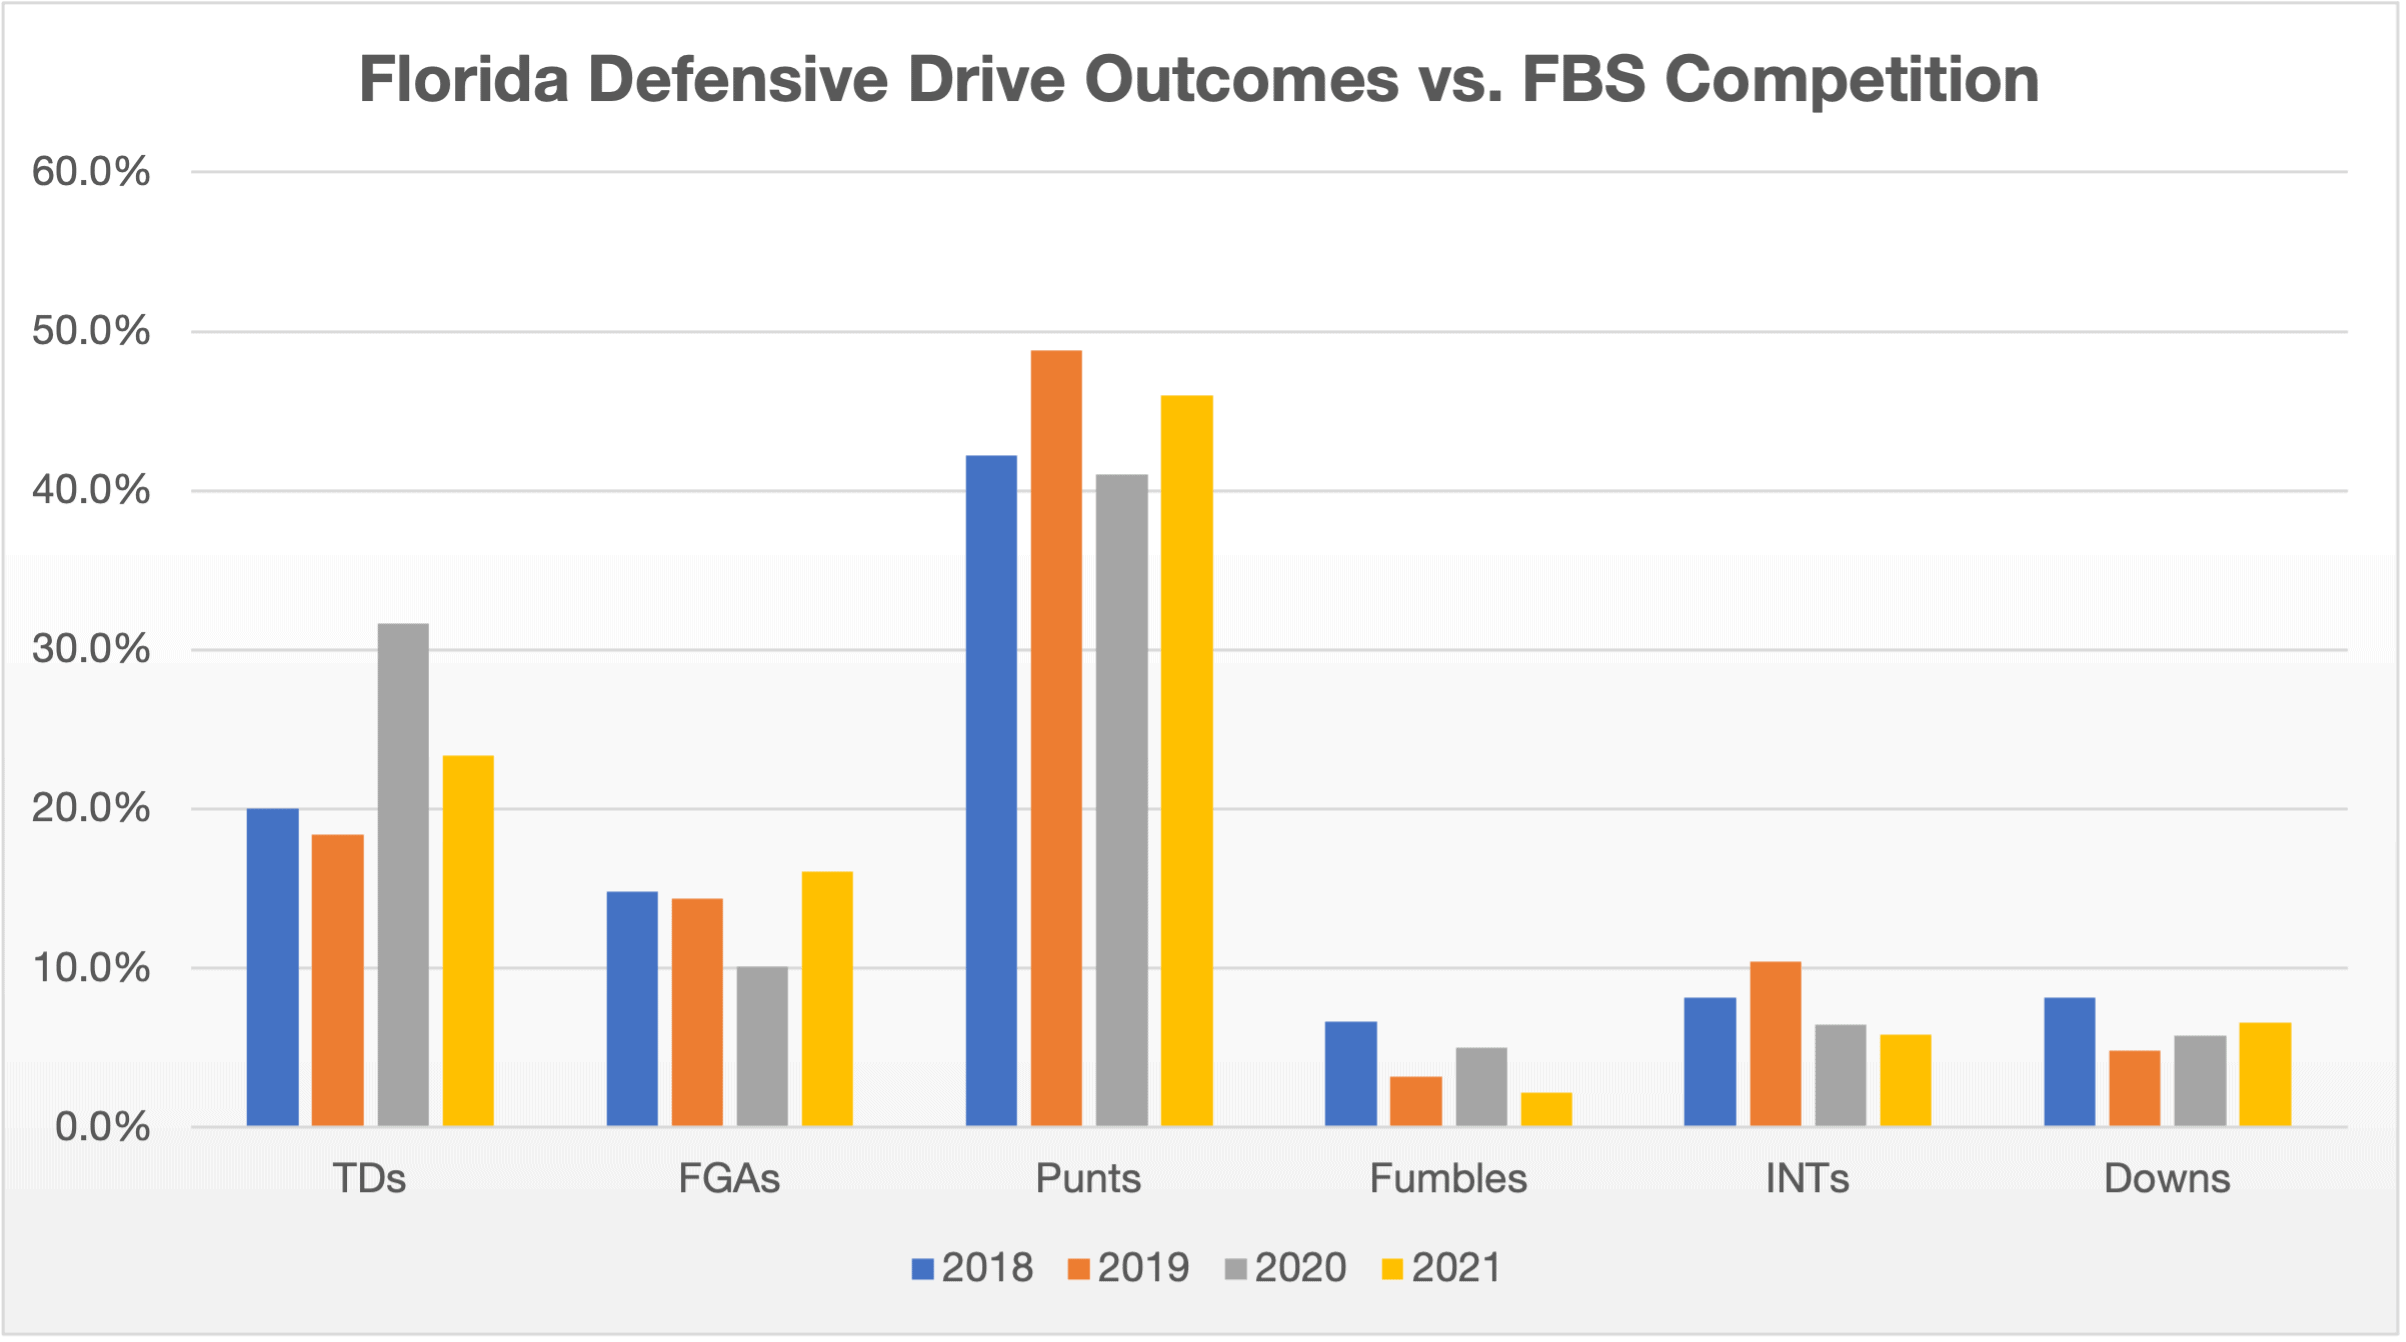
The best thing here is that the defense forced a lot of punts. Its punt rate of 46% is closer to 2019’s 48.8% than it is 2018’s 42.2% or 2020’s 41.0%.
However, its TD rate of 23.4% is well clear of the 20.0% that 2018 allowed. The field goal attempt rate is also the highest of all four years, which along with the higher touchdown rate suggests the defense let teams get too far down the field. You can see it in the TD/FGA rate and how it’s much closer to 2020’s rate than those of 2018 and 2019.
![]()
How did this happen despite the strong punt number? The team didn’t force many turnovers. They recovered just three fumbles all season, and the eight interceptions were the lowest of the Mullen era too. More of those TD/FGA drives should’ve been stopped short as turnovers, but they weren’t.
Even if you leave the offense at its underwhelming point scoring rate, the team could’ve won more games with a better defensive showing. Using the same win percentage prediction system from the top, the expectation comes out to 7.5 wins with the 2018 defense’s points allowed average or 8.7 with the 2019 defense’s average. Are those up to snuff for UF? No, but with the latter result, Mullen probably still has a job.
Let’s narrow things down even more and look at SEC competition specifically for a moment. That is closer to an apples-to-apples comparison since UF played some non-P5 FBS teams in 2021 but didn’t in 2020.
The 2021 team (352.3) allowed 52.4 fewer yards per game than the 2020 team did (404.7). That’s about 13% better and a good result; it’s tied with Mississippi State for third in the league. However, the points per game allowed only fell from 28.6 in 2020 to 26.5 in 2021.
The team, therefore, only improved from seventh to sixth in points per game allowed in SEC play. I’m sure the offense’s turnovers had something to do with the points per game dropping by only 7% compared to the 13% for yardage, but the defense simply didn’t end enough drives early to overcome that setback.
Once again, the problem was no margin for error. The offense performed at the bad end of the Mullen-era range in several categories. The defense couldn’t make up for it because it couldn’t turn opponents over. And as the defense couldn’t keep opponents out of the end zone or field goal range, the offense couldn’t stop turning it over and create enough points to make up for the generosity.
I won’t say that there are only small tweaks to be made to get the program back in ship shape, but there is room for immediate improvement next year. Turnovers are the obvious place, and regression to the mean is in UF’s favor.
The Gators had a -9 turnover margin against FBS competition. While that’s not quite enough to meet Phil Steele’s TURNOVERS = TURNAROUND threshold, the luck and randomness component to turnovers makes it likely at the very least that the Gators will be closer to an even margin. At the most, wild swings are possible: Kentucky went from +10 in 2020 to -11 in 2021 against FBS teams.
I’m hesitant to say more on that topic since the roster for next year is far from set on top of there being the challenge of installing new systems on both sides of the ball. I do hope this helps contextualize how Florida crashed so hard this year. Too many turnovers and too much punting on offense combined with too few turnovers and allowing too much encroachment into the scoring opportunity area on defense are the main culprits.